Two years ago, after being introduced to the computer program MATLAB at work, I conceived the brilliant plan of writing a computer program to pick the winners of football games against the spread. Armed with a semester’s worth of statistics expertise and a powerful processor, I was confident that I could beat the odds. It seemed so simple to outsmart all those silly rubes making bad bets based on their “gut instincts.” What fools! A clever fellow like me could harness the power of a “little magic box” and elevate myself to the financial status of a king.
My original theory was that Vegas set the point spreads for each game based on public perception – that they were angling to have about 50% of the money on each side. I figured that I could use the statistics from previous games to determine what the “true” spread should be, and it would be an easy way to pick winners. I entered five seasons’ worth of data by hand – point spreads, rushing yardage, turnovers, etc. – and set the computer loose to choose its own algorithm based on what would have worked best the previous several weeks. Based on a large-scale simulation, I thought its odds of working would be pretty good. Unfortunately, all the program really did was pick underdogs – the bigger the better. And in a season where favorites beat out underdogs 127-116 (including a Patriots squad that covered increasingly outlandish spreads the first eight weeks in a row), it turned into a pretty expensive lesson of what happens when you “overfit the curve.”
Last year, before the season started, I rewrote the whole thing. I entered more historical data, going all the way back to 1997. I made the code run more efficiently, and accounted for some additional factors like blowouts and stadium advantage. Rather than letting the model recalculate its own algorithm on a weekly basis, I used a static algorithm. Rather than just calculating the average expected score, the model ran a series of 500 simulations per game to figure out the distribution and likely odds of any particular point difference. And the first time I ran the program, I was horrified to see that amongst games where the computer felt 90% confident in the outcome of a game, it was only right about 42% of the time. That’s right, given the advantage of all the statistical data available for the last 11 years, hundreds of permutations, and gigabytes worth of computing power, the model was predicting at a rate of well less than fifty percent. And this taught me a lesson that gamblers throughout the world already know very well:
The oddsmakers in Vegas are greedy.
In some games, Vegas is content to set a spread that entices equal halves of the betting population to wager on each side of a game. And in other games, Vegas will set a spread exactly where it belongs, and be content that the law of averages (plus their convenient 10% juice) will take care of them in the end. But from time to time, the oddsmakers will have a strong premonition about the outcome of a game, trap the public with a tease of a line, and really rake in the cash.

Remember Week 7 of last year when the Jets traveled to Oakland to throw a few more logs on the fire of humiliation that was consuming the pathetic Raiders? At this point, the Jets were 3-2, having lost to New England and San Diego. The Raiders were 1-4, their one win coming against the slightly more pathetic Kansas City Chiefs. Vegas appropriately listed the Jets as favorites, but only by a measly three points. The public, seeing this as an opportunity to score some free money, jumped all over the Jets. Ninety-one percent of people had their money on the Jets. Often, when betting becomes this lopsided, Vegas will move the spread by half a point or more to try to even things out a bit. This time, they didn’t budge. Final score: Oakland 16, Jets 13 in overtime.
As it happens, my computer model actually saw this spread as being set perfectly and made a relatively small hedge bet on the Raiders. But more on that later.
If you’ve read this far, you’re probably curious as to how this program works. Conceptually, it’s not that complicated; it takes the various offensive and defensive statistics for each pair of teams from the previous 9 to 20 weeks of regular season games (including the previous season, where appropriate), and calculates the averages and standard deviations of each. It randomly picks values within the distribution for each statistic for each team, and combines this with the stadium advantage and road handicap, an adjustment for blowouts (both delivered and received), and a bonus or penalty based on each team’s turnover ratio. What’s emerges is a predicted score for the game – and a corresponding winner for a bet. It then repeats this process five hundred times for each game, and calculates the percentage of times it expects each outcome. It logs these and then moves on to another algorithm, with some changes in the various factors it uses. It uses a total of 360 algorithms, so for each single game it calculates a total of 180,000 potential outcomes. The amount to wager is dependent on how many different algorithms agree about the outcome of the game.
For example, during Week 4 of last year most of the algorithms predicted that the Pittsburgh Steelers would cover a 5 point spread at home against the Baltimore Ravens about 85% of the time. A few even predicted 90%. The computer then instructed me to bet a healthy hunk of money on Baltimore.
Wait, what?
What I saw when the computer was picking based on statistical advantage was the same thing that the public sees when they use their gut instincts (which is ultimately a crude statistical analysis) – consistent, reliable losses. If Vegas felt like playing nice, they’d either set the spreads where they actually belong, or set the spreads where the public thinks they belong, and reliably collect a generous 10% for every bet that is made. But they don’t. They burn the public week after week. The computer model, like most bettors, was able to consistently pick losers week after week, because it was getting trapped, just like the public does. But when a dispassionate computer allows you to subtract emotion from your predictions, being able to consistently pick losers is exactly the same as being able to consistently pick winners.
All you have to do is flip the outcome.
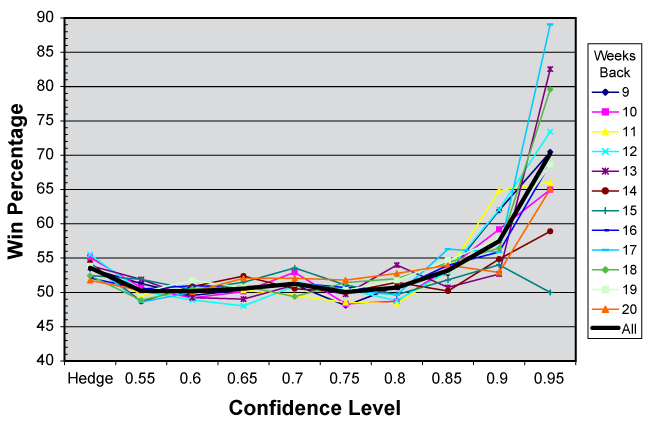
There aren’t opportunities like this in every game. When the computer is between 50% and 80% confident on the game’s outcome, it’s just statistical soup. For games where the computer makes a prediction with 85% confidence, its winning percentage over the last ten years is 52.8%. Against 10% juice, the breakeven point is 52.4%, so that’s just enough to make some money, but it’s nothing to be breathless about considering any given underdog will win 51.1% of the time. But at a confidence level of 90%, that win percentage is up to 57.6%. And if the computer feels 95% confident about a game, on average it’s right a staggering 71.6% of the time.

Unfortunately, lopsided matchups like this are rare. Games where the computer spits out a 90% confidence level only turn up about twice per week. Games where the computer is more than 95% confident only happen a few times every season. Last year there was only one.
In Week 3 the cratering Bengals (who wouldn’t see a single win until Week 9) came to the Meadowlands to face the red-hot Giants. The Giants were fresh off a 28-point thrashing of St. Louis, and had a bye the upcoming week, so they should have been entirely focused. Vegas set what they thought was an intimidating line of 13 (a line this high or higher is only seen in 4.1% of all games), and got spooked when money starting pouring in on the Giants. They pushed the line up to 14. And even though it’s a single point, it’s also a very significant point – it’s two full touchdowns. A line this high or higher is only seen in 2.1% of games – that’s just four or five times per season. Even the lowly Lions were underdogs by 14 or more just twice in 2008. Even then, 67% of the action was on the Giants. If Vegas really had confidence that the Bengals could keep this game close, would they have set the line so high, and then moved it up? Of course not. They’d have left it alone, or even pushed it down a half-point to induce more action on the Giants. Statistically, a thirteen point spread was too much. The computer loved this bet – 81 of the 360 models saw the Bengals covering this spread in over 95% of their simulations – and thus a trap, calling for a big bet on the Giants.
Unfortunately, the computer was wrong on this one. The Bengals, who obviously didn’t know their place, surprised everyone, taking the Giants all the way to overtime before succumbing to a field goal. But you can’t win them all. Historically, the computer has only seen a confidence level of greater than 95% in just 69 games – and it’s picked the right side in 43 of them.
One of the nice things about this model is that it tends to pick favorites. It’s a lot easier on the nerves to bet on a strong team and watch them gallop off to a 24-point lead by halftime, as opposed to betting on deep underdogs and biting your nails hoping they’ll complete a Hail Mary with sixteen seconds left to pull within twelve points and cover through the back door. But statistically, underdogs are the better bet. And if you’ve already weeded out some of the favorites which are more likely to win, your underdogs are more likely to win, too. So I adapted my model to account for this as well, and play some hedge bets on a few of the underdogs. I’ll explain more about that next week, and fill out the details of my betting scheme.
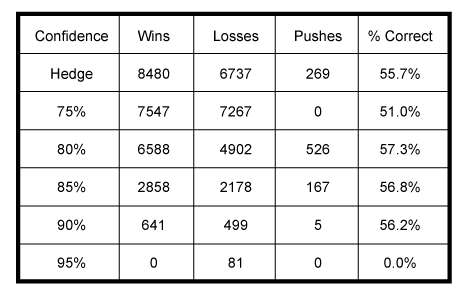
By this point you’re no doubt wondering how well this model did once I put my money where my mouth was. Here are the results for 2008:

The computer was very strong everywhere except for the 95% confidence level – and it’s important to remember that this only represents one game, the Bengals-Giants shocker I described above. I gave the computer $500 to play with at the beginning of the season, and scaled the amount of its bets by the various confidence levels for each game. By the end of the year, the computer was up to $820. Not too shabby. So this year, the adventure will continue. During the season I’ll have a post up every Wednesday morning with the computer’s predictions and how much it wants to bet, followed by my own analysis of why I either agree or disagree with each pick. Check in every week to see how things turn out – this should be fun.


Comments